Human leukocyte antigen (HLA) are cell surface glycoproteins encoded by Major Histocompatibility Complex (MHC) gene of human genome. HLA antigen frequency and haplotype distribution are useful for determining disease associations, origin, migration and genetic relationships between populations and predicting the outcome of transplantation. Thus, the present study was carried out to identify HLA class I (HLA-A and HLA-B) antigen and haplotype distribution among a selected Bangladeshi population. This retrospective study was conducted among 1070 individuals who were referred by clinicians for HLA typing at the Tissue Typing Laboratory of the Department of Virology, Bangabandhu Sheikh Mujib Medical University (BSMMU) during the period 2009 to 2011. For HLA typing, Blood was collected in heparin containing tube and the laboratory tests were performed by the microlymphocytotoxicity technique according to manufacturer′s instructions. Out of 19 HLA-A and 37 HLA-B antigens tested, a total of 19/19 and 36/37 antigens were detected respectively in this study. The most frequent antigens of HLA-A and HLA-B detected were A11 (25.4%), A24 (16.6%), B75 (18.1%) and B35 (11.3%). The least antigen frequency detected for HLA-A locus were A69 (0.09%), A26 (0.28%), A34 (0.28%), while for HLA-B locus were B81 (0.09%) and B56 (0.09%). Among the HLA-A and HLA-B antigens, some alleles were found to be homozygote such as A11 (4.0%), A2 (2.7%), A24 (2.1%) and B75 (2.4%), B35 (1.8%), and B44 (1.4%) respectively. The most frequent haplotype in the study population were A11: B75 (4.9%). The most frequent antigens of HLA-A and HLA-B detected were A11 (25.4%), B75 (18.1%) respectively. The distribution of HLA haplotypes among the study population indicates that it has the influence of Oriental and Asian populations. Thus, this study will be helpful to provide valuable information for population genetics and HLA disease association analysis.
Key words: Human leukocyte antigen, Allele, Haplotype frequency, Population genetics
Bangladesh is located in South Asia, bordered by India to its west, north and east, Myanmar to its southeast and the Bay of Bengal to its south. Its location is considered as the connecting land link between the subcontinent-Myanmar, South China and the Malay-peninsula and Indo china, lying at the cross roads of South East Asia, South Asia and Central Asia Bengal attracted people from the early civilizations of the fertile crescent; Central Asia Arabia, China and Europe. It has been accepted by anthropologists that Bangladesh has historically been a land of many races. The Bangladeshi population, as a part of South Asian Bengali population is a mixed breed of population of Dravidians, Mongols and Aryans. There is also admixture of aboriginals like Mundari and Santhals.1 In the 19th century, "Aryan race″ was defined as the subgroup of the Caucasian (Or Europoid) race consisting of native speakers of Indo-European languages descended from the original Proto-Indo-Europeans, in modern civilization that resided in different parts of the world including Bangladesh.2 Aryan migration brought several different peoples and cultures together. Over many centuries a fusion of Aryan and Dravidians resulted in Indo-Aryan synthesis which reconfigured the Indian population.3 Genetic study shows that Bengali population (Eastern India) had close ethnic affiliation with Caucasoids.4 This population formed clusters distinctly from the North East population groups (ethnic affiliation to Mongoloid), who are possibly descendents of ancestral population of China.5 Thus, the history of Bangladesh combines Indo-Aryan, Austro-Asiatic, Dravidian, Mughal, Arab, Persian, Turkic and British influences.6
There are several ethnic groups in Bangladesh, where 98% are Bengali and the remaining 2% belong to the Chakma, Bawm, Garo, Kiri, Marma, Tipuri and other ethnic minorities. The Bengali populations are natively concentrated in Bangladesh and in the Indian states of West Bengal, Tripura and Assam′s Barak valley. In India, there are also a number of Bengali communities scattered across Assam, the Andaman and Nicobar Islands and other Indian states. In addition, there are significant Bengali communities who are living as foreign workers in Pakistan, the Middle East, Japan, Malaysia, United Kingdom the United States and other countries. Thus, it can be said that Bengali as a community is not homogeneous.7
Human leukocyte antigen (HLA) has become interesting from the perspective of population genetics due to its high polymorphism, tight linkage among the loci and non-random association of alleles. The genes for these antigens play a central role in the immune response, disease susceptibility and progression and, in some instances, even resistance to certain diseases.8,9 Several studies show the association of different HLA alleles with particular diseases among different populations.10 The HLA system also plays a major role in allograft rejection. All the regions of HLA are known to be highly polymorphic, consisting of large number of closely linked genes that can be further split into many allelic types. Allele and haplotype frequencies of the HLA loci differ among various human populations and the studies of polymorphism in HLA system are useful for tracing the evolution of different populations and identification of conserved combination of different alleles.11,12 The different allele frequencies in different populations may account for increased resistance or susceptibility to diseases. Such information is helpful for identifying the differences thay may lead to better understanding of disease mechanisms.13-14 HLA has an important role in population genetics, donor selection for organ transplantation, paternity determination, various infectious and autoimmune diseases association, clinical utility in understanding drug reactions (antiretroviral, antiepileptic etc). Overall biological relevance to adaptive immunity and vaccine development demands extensive knowledge of HLA variations among populations.9 HLA profiles of Bengali people and some of the ethnic and tribal populations are available from different parts of India15-17 but as far as our knowledge, there is only one study on HLA profile among 141 Bangladeshi population living in Dhaka and HLA-A, HLA-B and HLA-DRB1 were determined using polymerase chain reaction with sequence-specific primers.6 Thus, the present study was aimed to obtain information concerning the distribution of HLA class I antigens in the Bangladeshi population and to compare the results with other populations.
This retrospective study was conducted among 1070 Bangladeshi individuals who were referred by clinicians for HLA typing at the Tissue Typing Laboratory of the Department of Virology, Bangabandhu Sheikh Mujib Medical University (BSMMU) during the period of 2009 to 2011. Their relevant information and HLA data were obtained from the record book of the Tissue Typing Laboratory.
Sample collection and laboratory methods: Fresh blood (5 ml) was collected in heparin containing tube and the laboratory test was performed by the microlymphocytotoxicity technique according to manufacturer′s instructions. Briefly, lymphocytes were separated by Ficoll-Hypaque density gradient centrifugation technique. Viable lymphocytes were incubated in Terasaki HLA Class I typing trays of One lambda, USA, containing known antisera or monoclonal antibody which was used to determine the presence of HLA Class I (19 HLA-A and 37 HLA-B) antigens on T lymphocytes. The addition of rabbit complement resulted in a structural changes of the cell membrane which led to penetration of an indicator dye. Finally, the lysed and viable lymphocytes were assessed using an inverted microscope.18
Calculation of HLA-A and HLA-B allele frequencies: HLA-A and HLA-B allele frequencies were calculated by direct counting using the following formula. Allele frequency = (sum of the individual allele)/2N, where, N is the number of individuals.
Linkage disequilibrium: Both linkage disequilibrium (LD) and normalized linkage disequilibrium methods used in this study are proposed by Lewontin.19,20 LD measures of the strength of association between pairs of HLA loci showed that the values ranging from -1.0 to 1.0 indicate strong positive associations between alleles in a haplotype ranges from a minimum of -1.0, when one or both of the constituent alleles are found in only one haplotype.21 A positive linkage disequilibrium was found for the following allelic associations:
Normalized linkage disequilibrium, D'=D/Dmax
where, Dmax=min(piqj, qipj)
when D>0
and Dmax=min(pipj, qiqj)
when D<0
Linkage disequilibrium, D= pij-pipj
Here pij is the haplotype frequency of ij, pi and pj are allele frequency of i and j respectively.
Hardy-Weinberg (HW) equilibrium was tested by Arlequin ver 3.5.2.2 based on the Guo and Thomson exact test22 and the statistical significance was determined using the Chi-square test. A cluster analysis was performed by single linkage minimum distance method to suggest the clusters of different world populations. In the present study, to perform cluster analysis, Euclidean distances based on HLA-A, HLA-B frequencies were estimated with the help of software R version 3.2.4. A bi-dimensional representation was carried out using the same software R version 3.2.4.
A total of 1070 Bangladeshi population comprising 362 (33.8%) females and 708 (66.2%) males were tested for HLA class I antigen and haplotype distribution. The mean age of the study population was 34±10.2, with age range from 4 to 70 years. Out of 19 HLA-A and 37 HLA-B antigens tested, a total of 19/19 and 36/37 antigens were detected respectively in this study.
For HLA-A locus, all the 19 antigens were observed in this study. The most frequently detected antigen for HLA-A locus wasA11 (25.4%). The other frequent HLA- A antigens detected were A24 (16.6%), A2 (15.6%), A33 (15.1%) and A1 (8.2%). The least detected antigen frequency for HLA-A locus were A66 (0.47%), A74 (0.45%), A23 (0.37%), A34 (0.28%), A26 (0.28%) and A69 (0.09%) (Table I).
Among the HLA-A antigens, some antigens were found to be homozygote′s, such as, A11 (4.0%), A2 (2.7%) and A24 (2.1%). The most common HLA-B antigen observed in this study was B75 (18.1%), followed by B35 (11.3%), B44 (9.6%), B51 (8.8%) and B27 (6.1%) respectively. The least common allele frequency observed were B54 (0.14%), B63 (0.14%), B81 (0.09%) and B56 (0.09%). In HLA-B locus, B77 was not detected, hence 36 out of 37 antigens were detected in this study (Table 1). Some homozygote′s, such as, B75 (2.4%), B35 (1.8%), and B44 (1.4%) were also detected in the HLA-B locus.
HLA-A antigen |
No |
Percentage |
HLA-B antigen |
No |
Percentage |
A11 |
543
|
25.37
|
B75 |
388 |
18.13 |
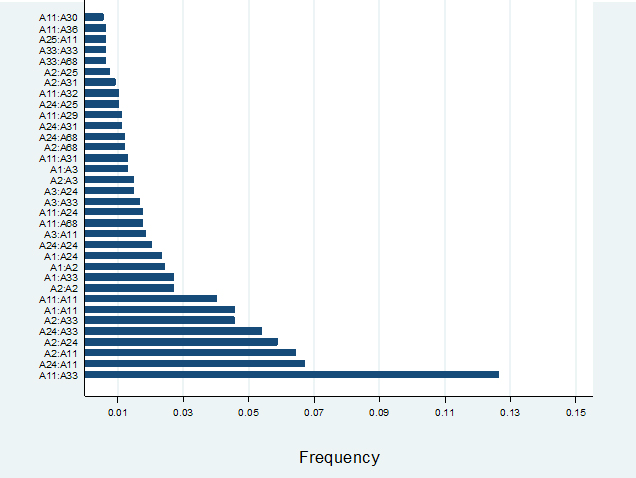
Among the HLA-A locus antigen serotypes, 111 combination of HLA A-A serotypes were observed and according to serotype frequency (>5), 34 of them were mentioned in this study (Figure 1). It was observed that A11:A33 was the most common serotypes followed by A24: A11, A2:A11, A2: A24, A24:A33. The least frequent serotype in the A locus was A11:A30.
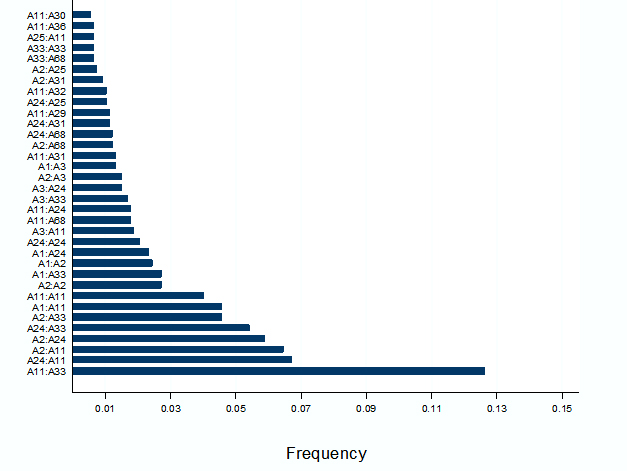
Moreover, among the B locus antigen serotypes, out of 287 according to serotype frequency (>8), 29 were mentioned in this study. B75:B35 was observed as the most common serotype frequency followed by B51: B75, B44:B75. B75:B38 and B75:B75. B13:B75 was the least common serotype (Figure 2).
The observed frequency, expected frequency, the linkage disequilibrium (LD) and normalized linkage disequilibrium in the Bangladeshi population is shown in Table II.
| Haplotypes observation | Observed frequency | Expected frequency | Disequilibrium | Normalized LD |
| A11:B75 | .04859813 | .04600489 | .00259324 | .01916603 |
| A24:B75 | .03551402 | .03016159 | .00535243 | .03930004 |
| A11:B35 | .03084112 | .02869377 | .00214735 | .02544555 |
| A02:B75 | .02990654 | .02821294 | .0016936 | .01329409 |
| A11:B44 | .02616822 | .02430671 | .00186151 | .02603948 |
| A33:B44 | .02523364 | .01450345 | .01073019 | .13199727 |
| A11:B51 | .02429907 | .0224096 | .00188947 | .02866830 |
| A33:B35 | .02383178 | .01712115 | .00671063 | .06992935 |
| A24:B51 | .01962617 | .01469211 | .00493406 | .06701518 |
| A02:B51 | .01682243 | .0137429 | .00307953 | .04129440 |
| A01:B75 | .01635514 | .01482662 | .00152852 | .02283111 |
| A33:B75 | .01635514 | .02745043 | -.01109529 | -.08951352 |
Both Linkage disequilibrium and normalized linkage disequilibrium methods are proposed by Lewontin.
Linkage disequilibrium, D= pij-pipj
Here, pij is the haplotype frequency of ij, pi and pj are allele frequency of i and j, respectively.
Normalized linkage disequilibrium, D'=D/Dmax
where, Dmax=min(piqj, qipj) when D>0
and Dmax=min(pipj, qiqj) when D<0
The study population was tested for Hardy-Weinberg (HW) equilibrium as shown in Table III, in which the calculations were performed on the basis of the observed and expected heterozygosity. Statistical significance was determined using the Chi-square test and it was found that Bangladeshi populations are not in the HW system.
Locus |
Observed |
Expected |
p |
Remarks |
HLA-A HLA-B |
0.88879 0.89533 |
0.84974 0.92121 |
<0.001 <0.001 |
Not in Hardy-Weinberg equilibrium Not in Hardy-Weinberg equilibrium |
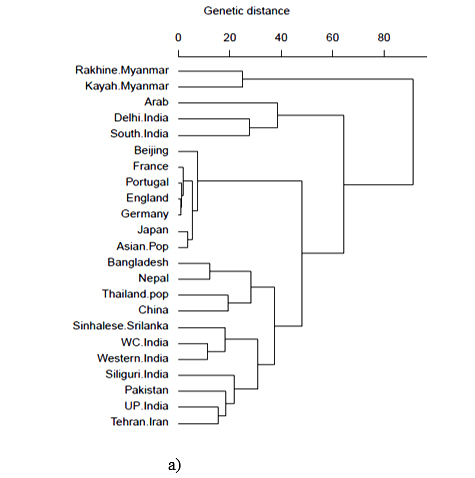
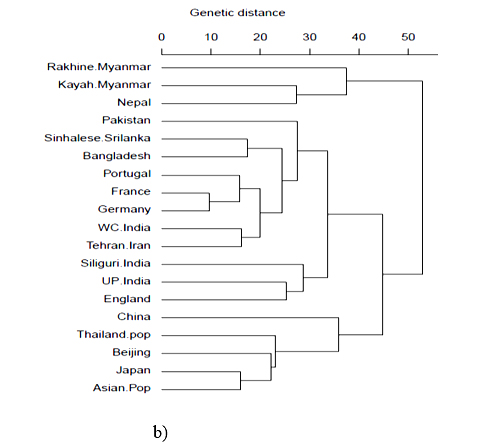
HLA-A and HLA-B frequencies were used for phylogenetic analysis with 23 HLA-A antigens and 19 HLA-B antigens respectively to compare the Bangladeshi population with world populations. It was observed that for HLA-A locus, our population and Nepal lie together in a cluster with Thailand pop and China. Moreover, for HLA-B locus, our population lies together with Sinhalese, Srilanka (Figure 3a and 3b).
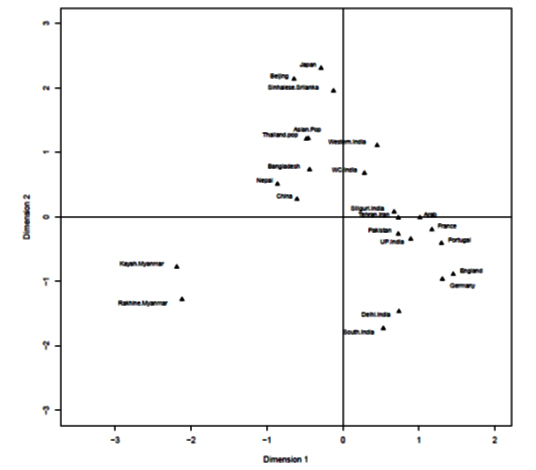
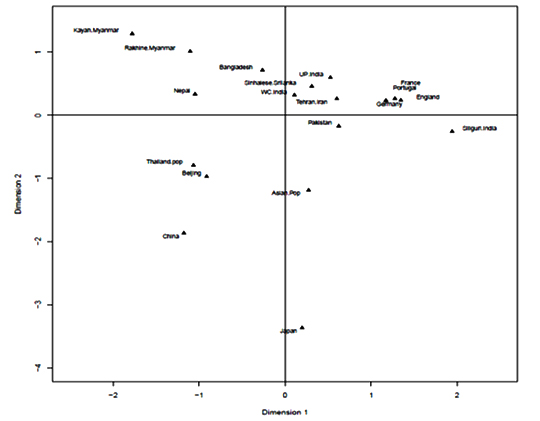
Correspondence analysis (CA) and its two-dimensional representation showed that Bangladeshi population scattered closely with Oriental and Asian populations (Figure 4-a, b).
Discussion
HLA typing has been used to identify different antigens in HLA class I and class II loci, making it a necessary tool for studying new alleles with variations in different regions. Moreover, the study of HLA frequencies and genetic distances can be used to assess the existence or absence of gene flow among neighboring population.23 Bangladesh is considered as a melting-pot of ancient people and the race is a mixed breed of population broadly consisting of Dravidians, Mongols and Aryans.1 This subcontinent has the genetic and cultural diversity due to repeated invasion by the Persian, Greeks, Turks, Arabs and Mongols over the centuries.24 In this study, antigen and haplotype analysis was carried out for HLA class I and the data was compared with various populations of the world to evaluate the genetic relation with other populations. The allelic frequencies of other ethnic regions were obtained from the database http://www.allelefrequencies.net.25
Analysis from this study showed that for HLA-A and HLA-B, the most frequent antigen was A11 with a frequency of 25.3% and B75 with a frequency of 18.1% respectively. Higher frequency of A11 is also observed in other populations including Myanmar, Singapore, China, Thailand, Malaysia (Peninsular), Taiwan, Pakistan, India (Siliguri).25,26 Thus, the distribution of HLA-A locus among Bangladeshi population indicates that it has the influence of Oriental and Asian populations. However, in a previous study from Bangladesh carried out among 141 samples, A11 was detected as the third highest frequent allele.6 This variation of HLA A frequency between the present and previous study may be due to disproportion between the sample size of these two studies, as the earlier study was done on only 141 samples, while the present study had a much larger sample size of 1070. When compared with world population, A11 is found to be less frequent in Cuba, Argentina, Kenya and among Black and Hispanic ethnic regions. The second most frequent allele in our study, A24, was the second highest allele6 and the most common allele among the Dravidian tribal communities of South India 27 and the northern Indian populations.28 A24 was also observed in Srilanka, India (Kerala), Pakistan, Taiwan, Japan, Caucasoid, Hispanic, Iraqi kurdish people, but less frequently among black people.25 Higher frequency of HLA A2, the third highest frequent allele in our study, has been reported in populations including Caucasians (28%), Russians (26%), South Indians, Kerala Hindu population (25%), and Turks (29%).29-32 A33 the fourth frequent allele in our study, was the most frequent allele in a previous study from Bangladesh.6 A33 was also reported as most frequent allele (16.17%) from Pakistani Burusho and the second most common among Pakistani Baloch ethnic group.24 HLA-A69 (0.09%), which was the least frequent antigen observed in our study was found among Caucasians, Ameriindian, American black ethnic people.25 Our study observed that for HLA-A locus, some antigens were homozygotes such as A11: A11 (4.0%), A2: A2 (2.7%), A24: A24 (2.1%). A study among Iranian population showed that A24: A24 (1.66%) was the most frequent allele homozygote followed by A2: A2 (1.33%) and A11: A11 (0.66%).33 In this study, it was also observed that A11:A33 was the most common serotype followed by A24:A11, A2: A11, A24: A33, while A11: A30 was the least common frequency. These findings correlate with antigen frequencies found in our study. A11:A2, the third serotype observed in this study has been reported most frequently from renal transplant recipients from West Central India.34
The most common HLA B types observed in the present study were B75, B35, B44 and B51. B75, which was the most frequent antigen was also reported among Chinese, Hongkong Chinese, Myanmar rakhine, Malaysia peninsular, Singapore Chinese and Indonesian populations. Thus, it has influence of the Oriental and Western Asian regions. In Siliguri (India), B8 (22%), B7 (17%), B18 (14.50 %), B37 (17 %) were found to have increased frequency.26 In the present study, it was also observed that B75:B35 was the most common antigen frequency followed by B51: B75, B75:B38, B44:B35, while B51:B44 was the least common frequency. B44:B61, which was the most frequent antigen among renal transplant recipient from West Central India, was not observed among the 29 mentioned serotypes of our study.34 Similarly HLA-B locus had some homozygotes such as B75 (2.4%), B35 (1.8%), and B44 (1.4%). A study from Iranian population showed that B35: B35 (0.83%) was most frequent homozygote followed by B51: B51 (0.41%), B13: B13 (0.25%) and B18 (0.25%).33
A11:B75 (4.9%) were the two most observed locus haplotypes among the Bangladeshi population, followed by A24:B75 (3.6%), A11:B35 (3.1%), A2:B75 (3.0%), A11:B44 (2.6%). The class I haplotype A11: B75 identified in our study was reported in higher frequency from Myanmar chin (18.1%), China Yunnan Bulang (19.7%) and China Yunnan Province Han (11.6%). The Indian Mumbai Maratha (1.6%), China Guizhou Province Shui (5.1%), Vietnam Hanoi kinh pop2 (7.0%) Hongkong Chinese (6.2%), Taiwan pop 2 (3.3%), Malaysia Peninsular Chinese (1.03%), Singapore Chinese (2.7%), Germany DKMS china minority (1.6%) and USA Asian pop 2 (1.96%), USA NMDP Vietnamese (5.6%), USA Asian (3.6%) populations have frequencies similar to the findings of this study.25In this neighboring region in Siliguri (West Bengal), the two locus haplotype analysis revealed that A1-B37, A1-B40, A29-B40, A30-B51 and A31-B40 were the most frequent haplotypes.26 In a previous study in Bangladesh, A33-B44 was found to be the most frequent allele,6 but this was observed as the sixth frequent allele in our study. Thus, the two locus haplotypes A11: B75 revealed that the Bangladeshi population belongs to the Asian population and is most closely related to Oriental groups than to European groups.
Interestingly, on testing the study populations for Hardy-Weinberg (HW) equilibrium, it was found that they are not in the HW system. This is because natural populations with whole genotypes in Hardy-Weinberg equilibrium are rarely found. Population cannot be infinite and are not completely isolated from one another, and migration of individuals into or out of one population can change its genetic makeup. This may probably explain the reason why our populations are not found in the HW system.
HLA-A and HLA-B frequencies were used for phylogenetic analysis to compare the Bangladeshi population with 23 and 19 world populations respectively. It is obvious that geographically separated populations are more likely subject to selection in distinctive environments;35 hence genetic distances fairly correlates with geographic distance. Genetic distance here refers to genetic divergence between species or between populations within a species. Small genetic distances indicate a close genetic relationship between two populations, whereas larger genetic distances indicate a distant genetic relationship.36 From phylogenetic analysis, our study observed that for HLA-A locus, our population and Nepal lie together in a cluster with Thailand pop and China. Moreover, for HLA-B locus, our population lies together with Sinhalese, Srilanka. Hence, Correspondence analysis (CA) and its two-dimensional representation was presented for better insight into relation among populations and to reveal those relationships visually. This analysis showed that the Bangladeshi population scattered closely with Oriental and Asian populations. This result of the phylogenetic as well as correspondence analysis correlates with the historical context as the territory comprising Bangladesh was inhabited by Indo -Aryan, Dravidian, Persian and Mongol-Mughal.
Conclusion
The study showed that the most frequent antigens of HLA-A and HLA-B detected were A11 (25.4%), B75 (18.1%) respectively. The findings of the distribution of HLA haplotypes among the study population indicate that it has the influence of Oriental and Asian populations. Thus, the data of this present study represents an important source of information for organ transplantation, HLA disease association and population genetics.
References
- Mazumder PP. People of India: biological diversity and affinities. Evol Anthrop.1998;6: 100-10.
- Rand McNally′s World Atlas International Edition Chicago: Rand McNally Map: "Races of Mankind″. 1944: 278-79.
- Wolpert S. A New History of India. 6th Edition, New York: Oxford University Press. 2000: 35-36.
- Kashyp VK, Chattopadhay P, Dutta R, Vasulu TS. Genetic structure and affinity among eight ethnic populations of Eastern India: based on 22 polymorphic DNA loci. American Journal of Human Biology. 2004; 16: 311-27.
- Banerjee A, Datta S, Chandra PK, Roychowdhury S, Panda CK, Chakravarty R. Distribution of Hepatitis B virus genotypes. Phylogenetic analysis &virological characteristics of Genotype C circulating among HBV carriers in Kolkata, Eastern India. World Journal of Gastroenterology. 2006; 12: 5964-71.
- Ali ME, Ahmed MU, Alam S, Rahman MH. HLA A, -B and DRB1 allele frequencies in the Bangladeshi population. Tissue Antigen. 2008; 72: 115-19.
- Raha PK. HL-A distribution amongst Bengalee Population. Ind J Med Res. 1975; 63: 242-52.
- Bodmer WF. HLA structure and function: A contemporary view. Tissue Antigens.1981; 17:9-20.
- Thorsby E. HLA associated diseases. Hum Immunol.1997; 53:1-11.
- Lechler R, Warrens A. HLA in health and disease. London: Academic Press; 2000:219-30.
- Cullen M, Noble J, Erlich H, Thorpe K, Beck S, Klitz W, et al. Characterization of recombination in the HLA class II region. Am J Hum Genet. 1997; 60:397-407.
- Bodmer WF. Evolution and function of the HLA region. Cancer Survey. 1995; 22:5-16.
- Hirayama K, Zaidi AS, Lokman Hakim S, Kimura A, Ong KJ, Kikuchi M, et al. Molecular analysis of HLA-B in the Malaysian aborigines. Tissue Antigens. 1996; 48:692-97.
- Dhaliwal JS, Too CL, Lisut M, Lee YY, Murad S. HLA-B27 polymorphism in the Malays. Tissue Antigen. 2003; 62: 330-32.
- Balakrishanan K, Pitchappan RM, Suzuki K, Shankarkumar U, Santhakumari R, et al. HLA affinities of lyers, a Brahmin population of Tamil Nadu, South India. Hum Biol. 1996; 68: 523-37.
- Agrawal S, Arundhati K, Brabwaj U, Bhatnagar S. HLA antigen and haplotype frequencies in Bhargavas and Chaturvedis of UP (India). Ind J Hum Genet. 1999; 5: 25-30.
- Chhaya SU, Shankarkumar U. HLA antigen distribution in Jain population from Mumbai, Maharastra, India. Ind J Med Res. 2001; 114: 25-29.
- Terasaki PI, McClelland JD. Microdroplet assay of human serum cytotoxine. Nature. 1964; 204: 998-1000.
- Lewontin R.C & Kojima, K. The evolutionary dynamics of complex polymorphisms. Evolution. 1960; 14:458-72
- Lewontin R.C. The interaction of selection and linkage.I. General considerations; heterotic models. Genetics. 1964; 49:49-67
- Trachtenberg EA, Erlich, HA, Rickards O, DeStefa AGF and Klitz W. HLA Class II linkage disequilibrium and Haplotype Evolution in the Cayapa Indians of Ecuador. Am J Hum Genet. 1995; 57:415-24.
- Guo, S & Thompson, EA. Performing the exact test of Hardy Weinberg proportion for multiple alleles. Biometric. 1992; 48: 361-72.
- Gomez-Casado E, del Moral P, Martinez-Laso J, Garcia-Gomez A, Allende L, Silvera-Redondo C, et al. HLA genes in Arabic-speaking Morococcans: Close relatedness to Berbers and Iberians. Tissue Antigens.2000; 55:239-49.
- Mohyuddin A, Ayub Q, Khaliq S, Mansoor A, Mazhar K et al. HLA polymorphism in six ethnic groups from Pakistan. Tissue Antigens. 2002; 59: 492-501.
- Gonzalez-Galarza FF, Christmas S, Middleton D, Jones AR. Allele frequency net: A database and online repository for immune gene frequencies in worldwide populations. Nucleic Acids Res. 2011; 39: D913-19.
- Singh B, Mallick GC, Bandopadhay S, Nayak CR & Chaudhuri TK. Study of selected HLA-A and –B Antigens by PCR-SSP method in Bengali population of Siliguri and adjoining areas of West Bengal. Int J Human Genet. 2009; 9: 245-49.
- Thomas R, Banerjee M. HLA-A allele frequency and haplotype distribution in the Dravidian tribal communities of south India. Indian J Hum Genet. 2005: 11: 140-44.
- Rajalingam R, Krausa P, Shilling HG et al. HLA diversity in a panel of north Indian Hindus. Immunogenetics. 2002; 53: 1009-19.
- Chanock SJ, Foster CB, Miller FW, O′Hanlon TP. HLA-A, -B, -C, -DQA1 and -DRB1 alleles in a Caucasian population from Bethesda, USA. Hum Immunol.2004; 65:1211-23.
- Evseeva I, Spurkland A, Thorsby E, Smerdel A, Tranebjaerg L, Boldyreva M, et al. HLA profile of three ethinic groups living in the North-Western region of Russia. Tissue Antigens.2002; 59:38-43.
- Thomas R, Nasir SB, Banerjee M. A crypto-Dravidian origin for the non-tribal communities of South India based on human leukocyte antigen class I diversity. Tissue Antigens.2006; 68:225-34.
- Uyar FA, Dorak MT, Saruhan-Direskeneli G. Human leukocyte antigen-A, -B, -C alleles and human leukocyte antigen haplotypes in Turkey: Relationship to other populations. Tissue Antigens.2004; 64:180-87.
- Ghashghaie A, Alimoghaddam K, Ostadali MR, Ghaffari H, Khansari L, Sadraee M, Mirrasekhian E, Mohyedin I, Raoofi F, Noori Z, Yaghmaian H, Eshaghi H, GhavamzadehA.Allele Frequencies of HLA Class-I Loci in the Normal Iranian Population. IJHOSCR. 2009; 3:18-20.
- Patel JS, Patel MM, Koringa PG, Shah TM, Patel AK, Tripathi AK, Mathew A, Rajapurkar MM, Joshi CG. Human leukocyte antigen alleles, genotypes and haplotype frequencies in renal transplant donors and recipients from West Central India. Indian Journal of Human Genetics. 2013; 19:219-32.
- Ding K, Kullo IJ. Geographic differences in allele frequencies of susceptibility SNPs for cardiovascular disease. BMC Med Genet. 2011; 12:55.
- Hattemer HH. Genetic distance between populations. Theor Appl Genet 1982; 62: 219-23.